Some Advertising Projections
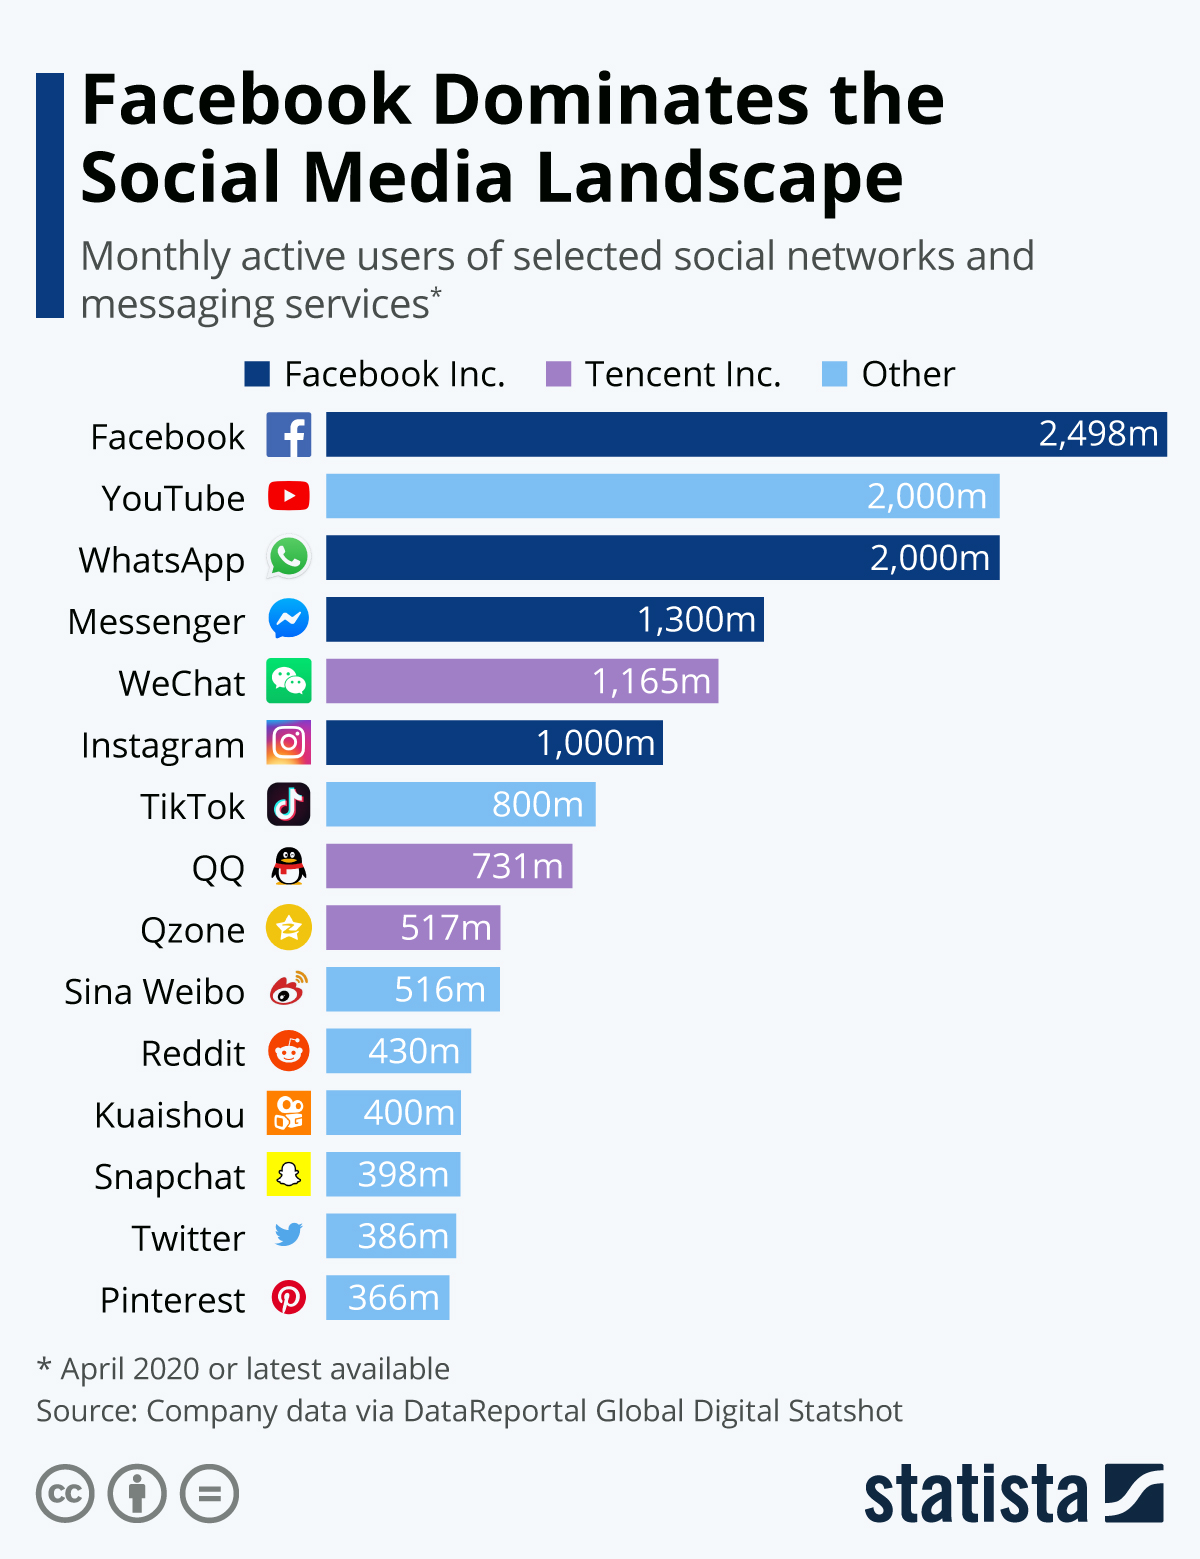
These are some national trends we believe are valuable for our authors to consider. The first infographic below shows the dominance of Facebook. Despite this dominance, while our Facebook advertising has been productive to some extent, it is becoming harder and harder to sell via Facebook. Facebook is also the dominant target for disinformation campaigns. Why? It’s the biggest. I’m reminded of the cartoon about Robin Hood that has him saying, “Oh, I’d rob from the poor too, but they’re always broke!”
I posted another chart about disinformation campaigns on Facebook by country of origin on my personal blog.
 You will find more infographics at Statista
You can find more information about this chart on Statista.
The second chart shows advertising spending in general. We have never found print or TV advertising to be effective, but you can see the general trend toward the internet. You should combine these numbers generally by changes in the way people access content, for example, watching TV shows on your phone.
 You will find more infographics at Statista
Again, you can find some discussion of this chart on Statista.
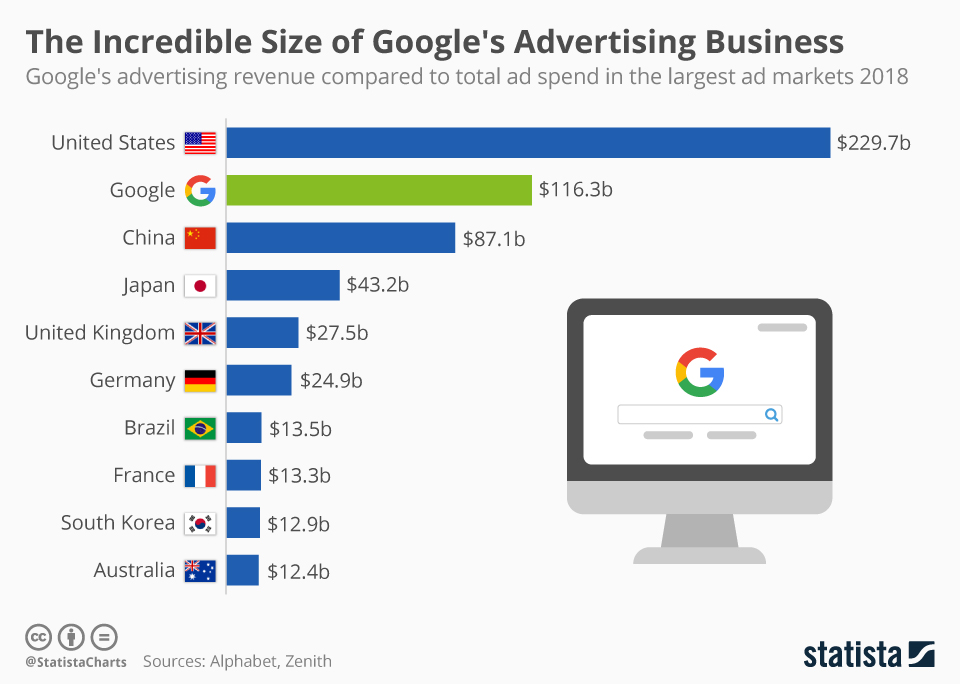
Finally, a look at Google’s dominance in the advertising business:
 You will find more infographics at Statista
Again, you can find some discussion on Statista.
We are taking these statistics into account as we try to improve Energion’s profile on the internet. Doing business these days requires one to be quick to respond to changes.
Featured image by Gerd Altmann from Pixabay

